Precision dose measurement for electronics manufacturing.

Measure the dose your components actually receive during X-ray inspection (AXI) — in real time, at the component location, under the real inspection program.

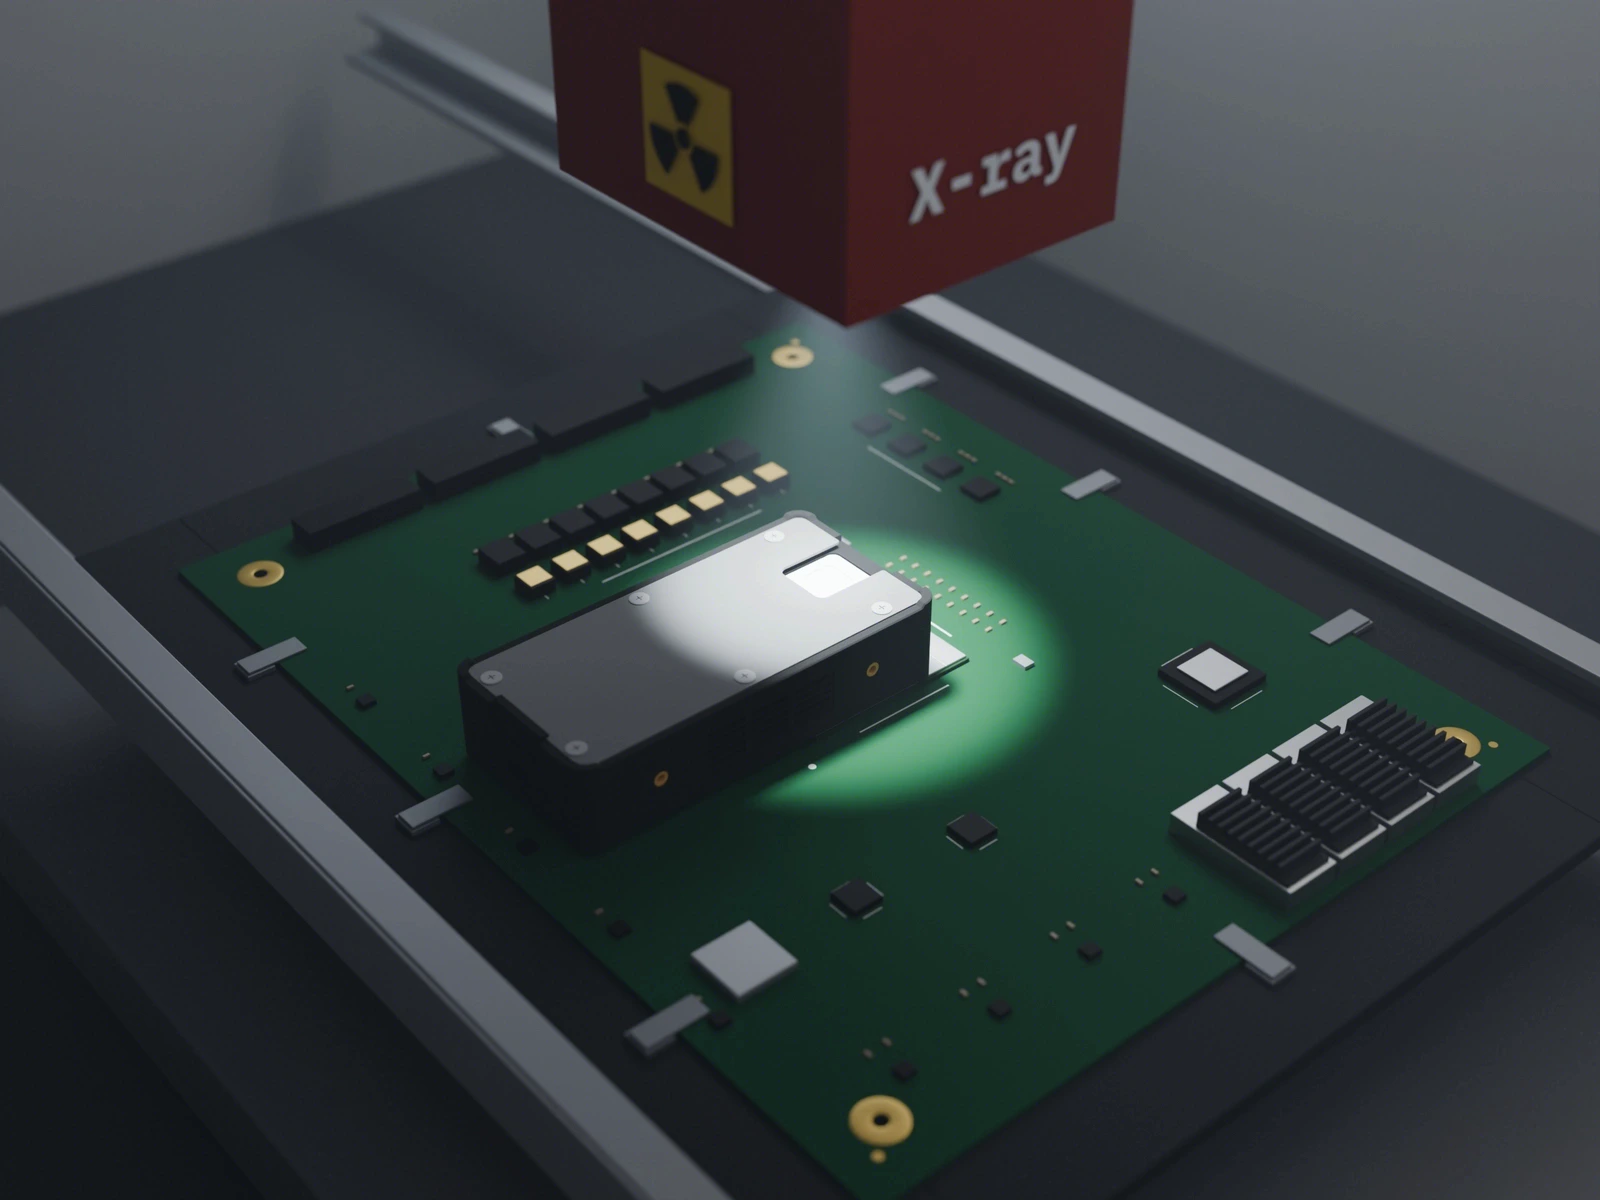
XD3 dosimeter lying face-down on a large chip on a PCB inside an X-ray inspection machine, its detector window under the beam. The source above the board is marked with a radiation trefoil and the word X-ray.

The problem

Every inspection leaves a dose behind.

X-ray inspection is standard practice in PCB assembly — it is the only practical way to verify solder joints and interconnects hidden from optical inspection. But while it runs, every component on the board is absorbing ionizing dose. The most advanced of them — built on fine process nodes, stacked memory, and dense packaging — are precisely the ones most sensitive to that dose. And the risk is not theoretical: measurable degradation has been observed in memory components at inspection-level doses.

How much dose? Many factors feed into it, but they fall into two broad groups: geometry (where the component sits, what surrounds it on the board) and the beam itself (tube settings, scan procedure, dwell time).

For example, take the simplest useful picture: one component, mounted either facing the beam (case A) or on the far side of the board (case B). Its dose then splits by direction of arrival — a contribution delivered from the source side (D0), and another returning as backscatter from below (D1). An asterisk marks a contribution that reached the component through the board; the board strongly attenuates the beam but barely touches the harder backscatter. Measured on one production-class AXI machine, the two cases compared like this:

Dtotal = D0 + D1*— case A
Dtotal = D0* + D1— case B

Case A — component facing the beamSide view with the X-ray source above, the PCB in the middle and the image sensor below. The component sits on top of the board, facing the source: the direct contribution D0 arrives at full strength from above, and the backscatter contribution D1-star arrives from the sensor side below after passing the board almost unattenuated.Case AX-raysourceD0targetcomponentPCBD1*image sensorCase B — component behind the boardSide view with the X-ray source above, the PCB in the middle and the image sensor below. The component hangs under the board, away from the source: the source contribution is attenuated to the much weaker D0-star by passing the board, while the backscatter contribution D1 arrives directly from the sensor side below.Case BD0*targetcomponentD1
Dose contributions at the component: case A versus case BTwo stacked bars, one row per mounting case, compare the total dose at the same component. Case A, facing the beam: a long source-beam contribution plus a small backscatter one. Case B, behind the board: the source contribution shrinks to roughly a tenth after passing through the board, while the backscatter contribution stays the same size — so the two are comparable, and the case B total is several times smaller than case A.D0 — from the sourceD1 — backscatterCase AD0D1*Case BD0*D1* measured after passing through the boardproportions from one measured setup —they vary with board, machine, and program
Dose contributions at the component: case A versus case BTwo stacked columns, one per mounting case, compare the total dose at the same component. Case A, facing the beam: a tall source-beam contribution plus a small backscatter one. Case B, behind the board: the source contribution shrinks to roughly a tenth after passing through the board, while the backscatter contribution stays the same size — so the two are comparable, and the case B total is several times smaller than case A.D0 — from the sourceD1 — backscatterD0D1*D0*D1Case ACase B* measured after passing throughthe boardproportions from one measuredsetup — they vary with board,machine, and program

And those are totals for one full run — moment to moment, the mix shifts as the beam moves across the board. None of this can be read off a settings screen; the only number you can trust is one measured at the component location, under the real inspection program.

That is what XD3 is built for.

Silicon dosimeter

XD3 reads dose to silicon, right where the component sits.

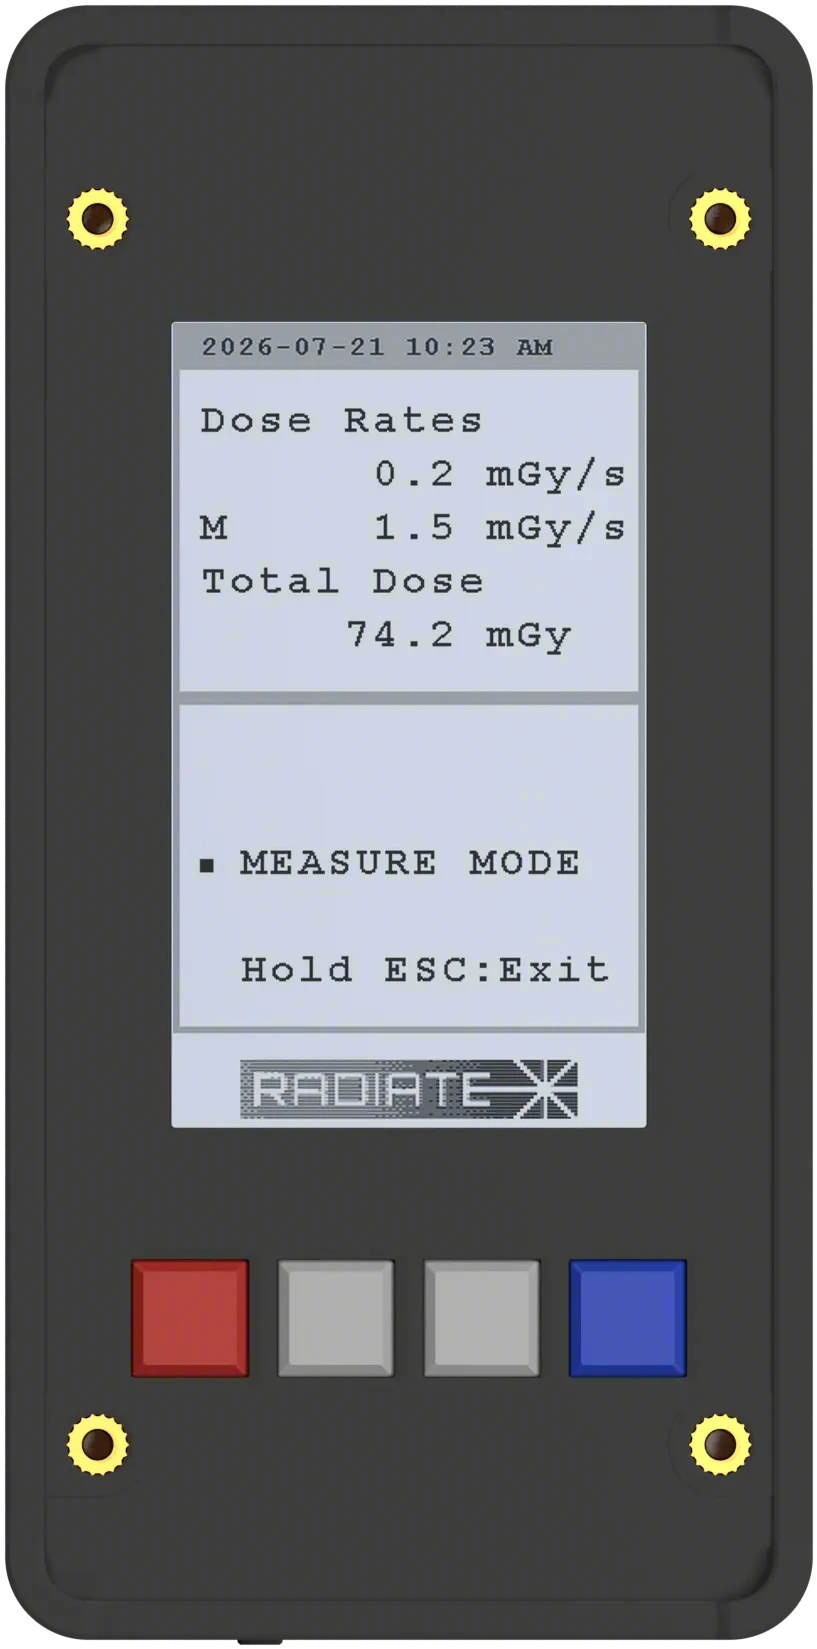
XD3 front: the e-paper display in measure mode, reading dose rates and total dose, with four buttons below it.
Front
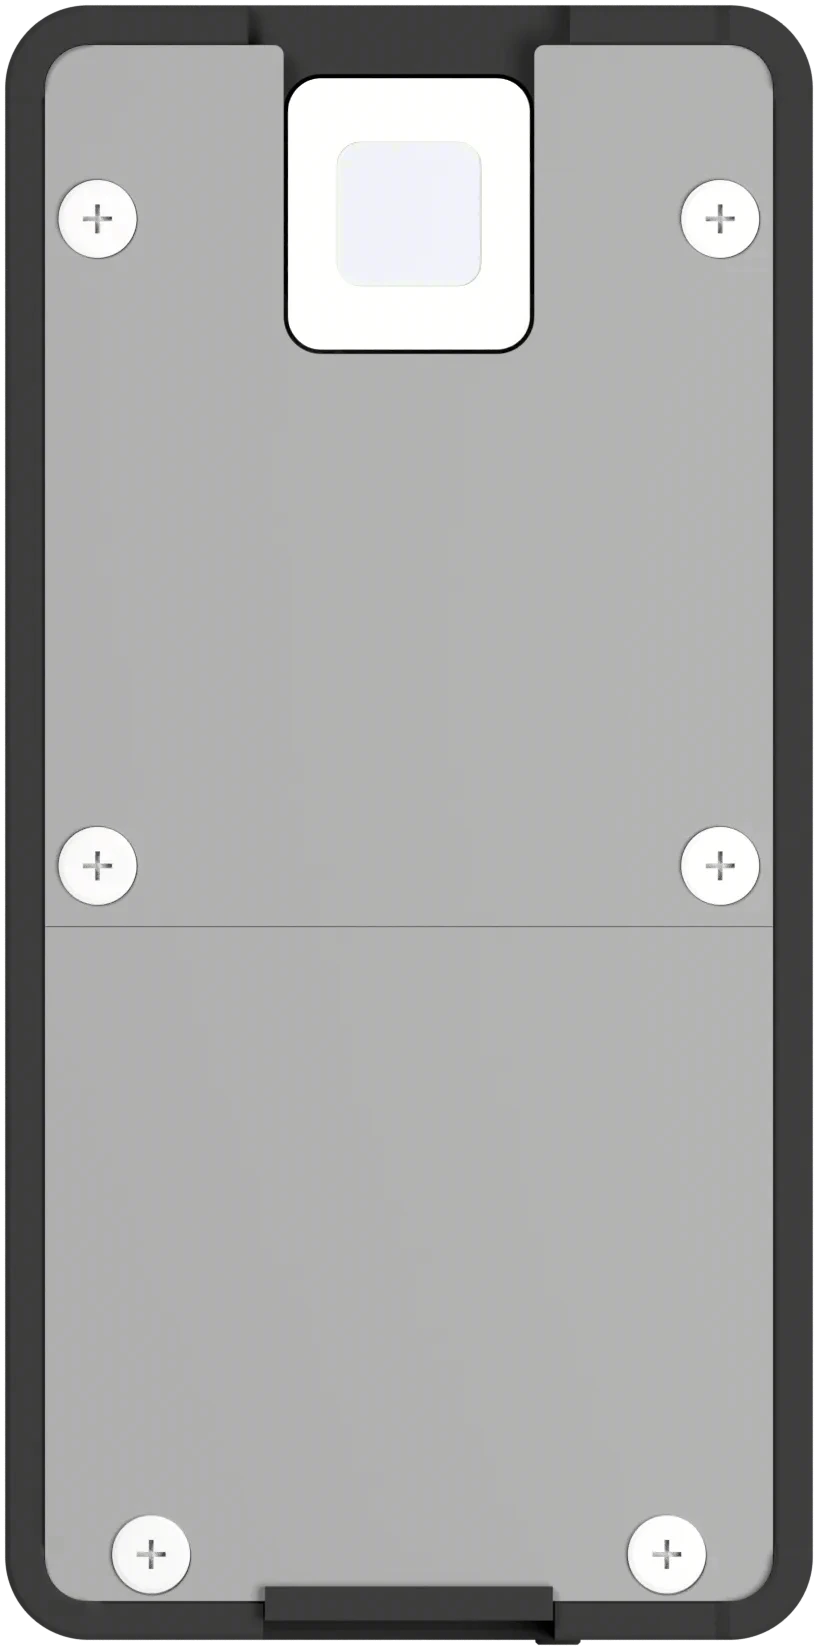
XD3 back: the detector window sits at the top, facing the beam.
Back
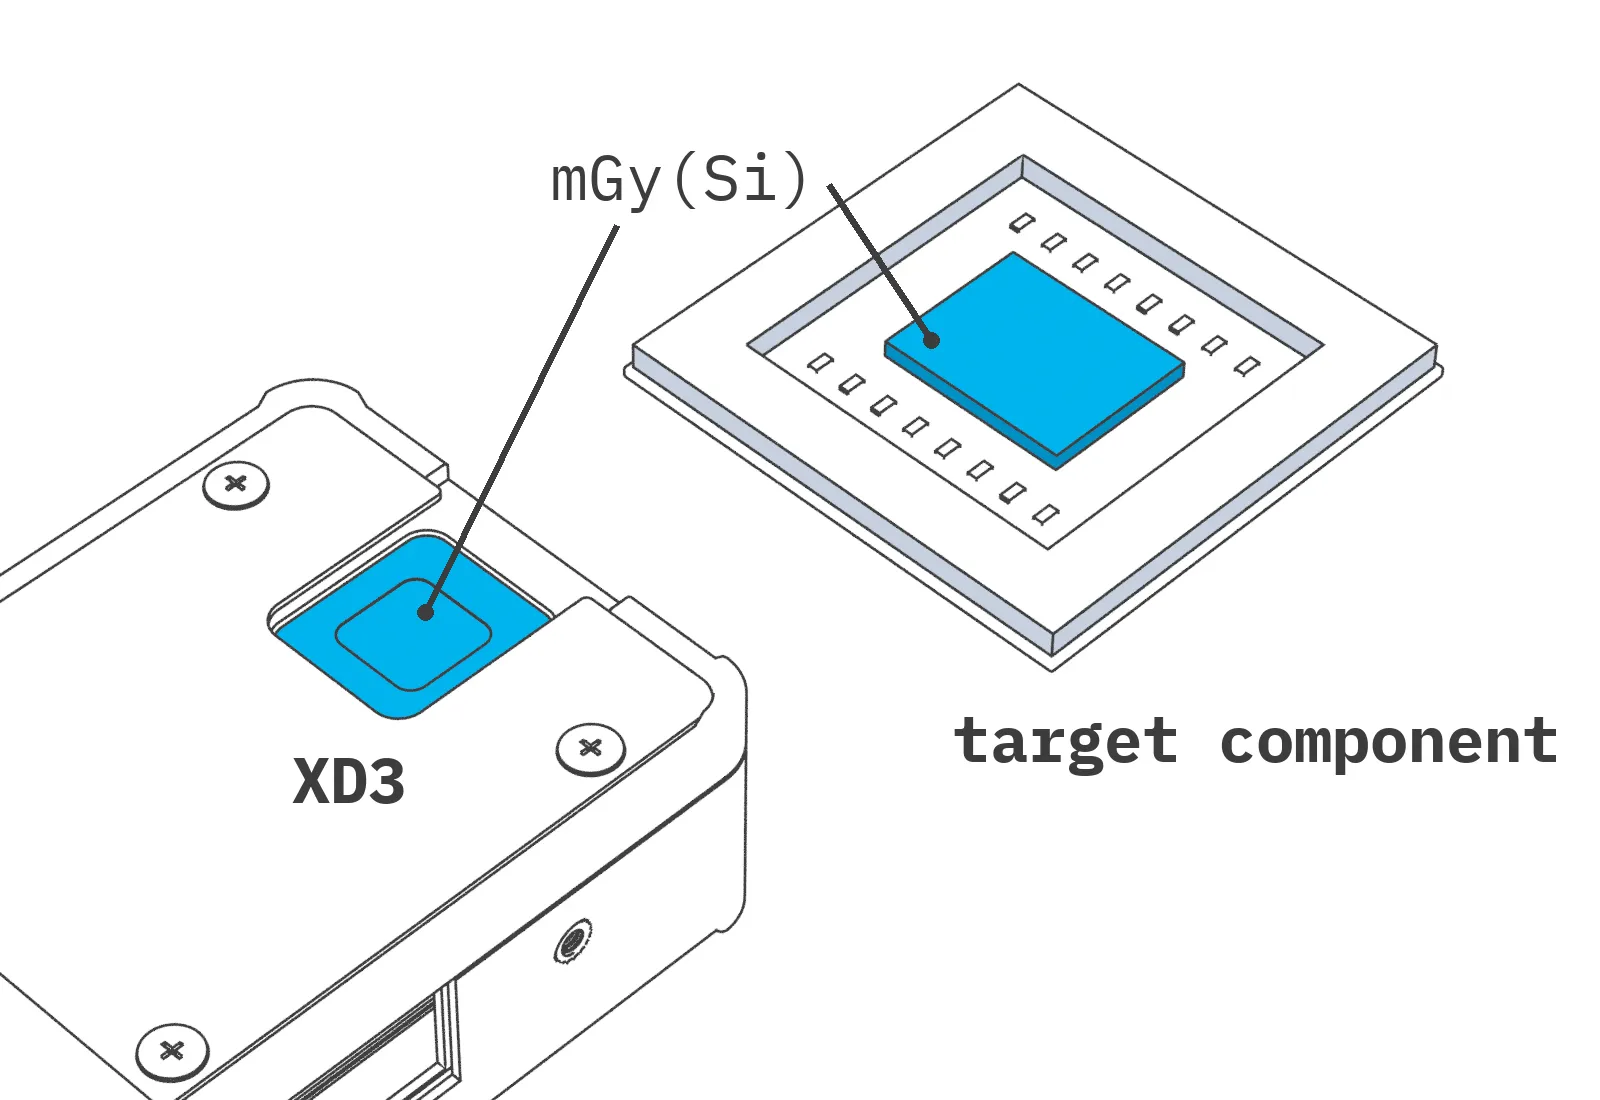
Diagram: the XD3 detector window and a target component, both marked mGy(Si) — the silicon detector reads the same dose-to-silicon the component receives.

Reads directly in mGy(Si)

Absorbed dose to silicon, stated exactly — the quantity that matters for semiconductor components.

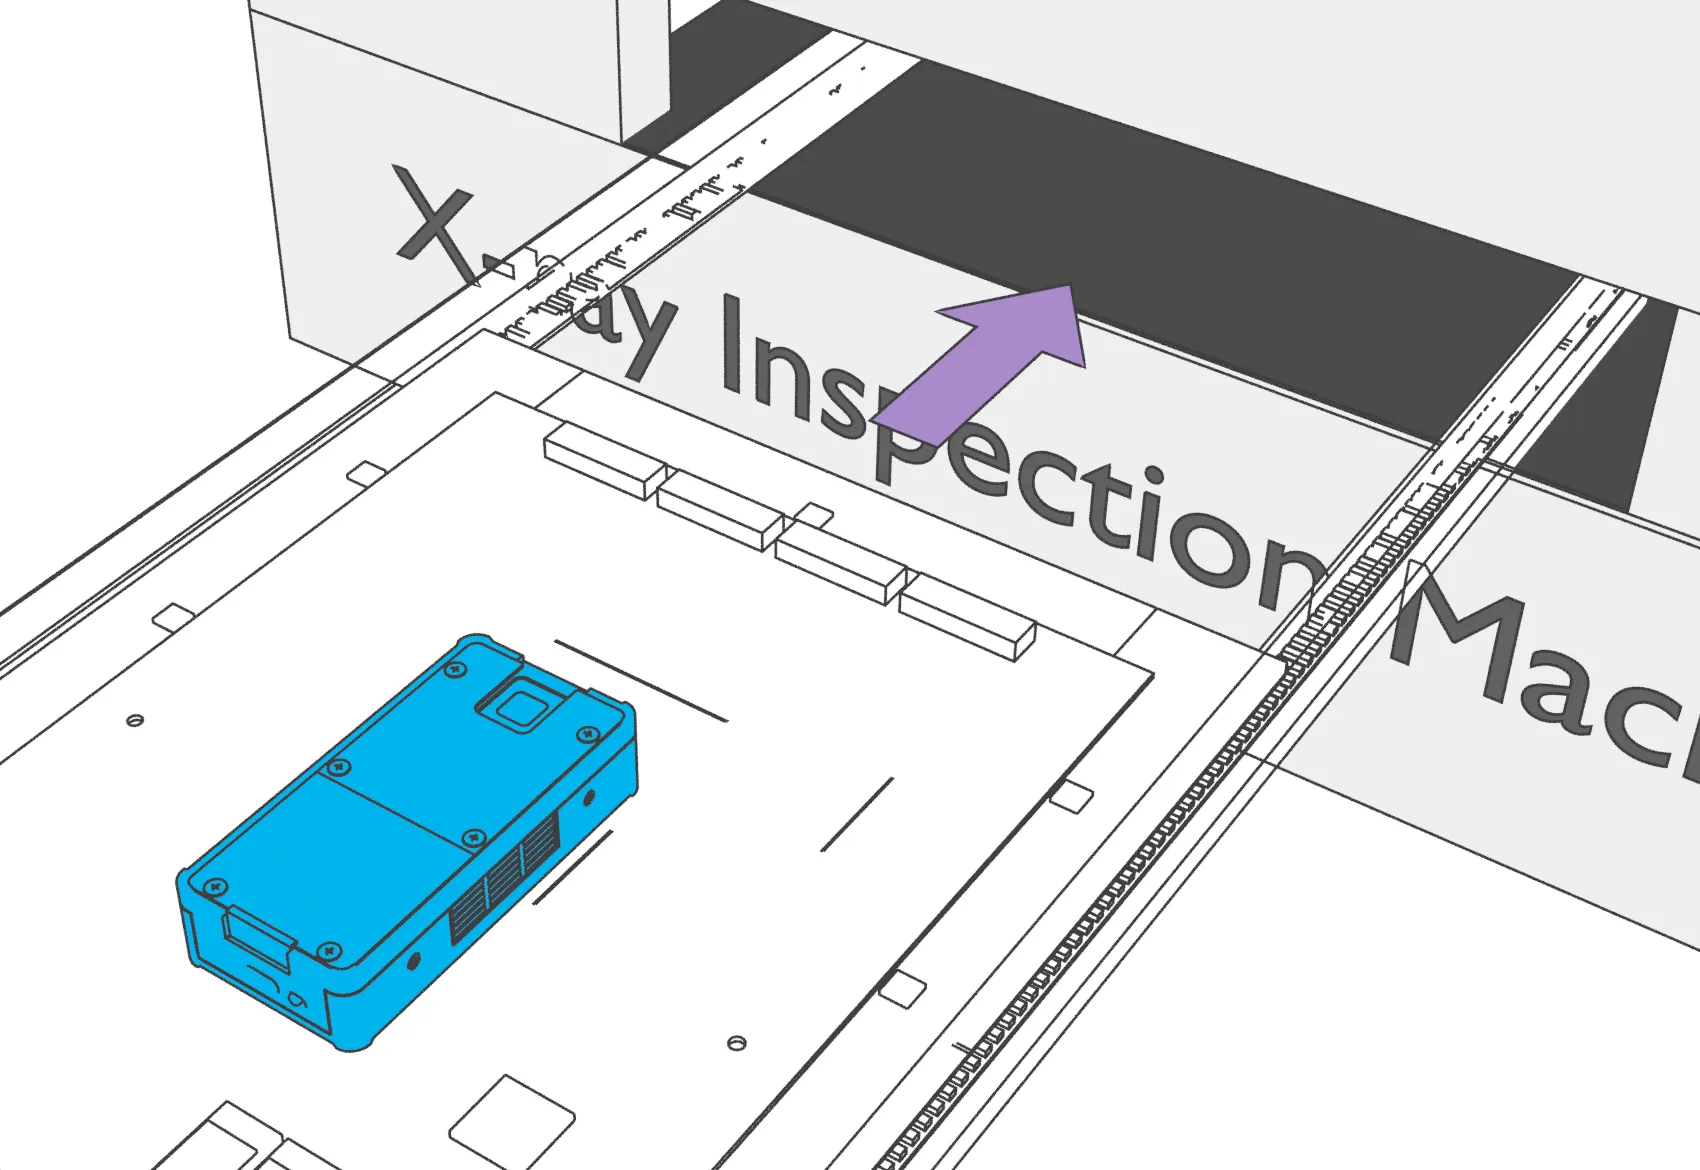
Sketch: a PCB with XD3 attached rides the conveyor into an X-ray inspection machine, an arrow showing the board entering the opening.

Rides in on your board

Travels through the inspection machine with the board — no change to your machine or your inspection program.

  • Real-time wireless monitoring — dose rate and total dose live over Wi-Fi as the inspection runs.
  • No network setup — XD3 hosts its own access point; connect a PC directly and start measuring.
  • Captures on its own — once a run is armed, XD3 records it whether the wireless link holds or not.

Not sure it fits your setup? Tell us your machine and component — we'll tell you whether XD3 can measure it.

Companion software (Windows app)

XBase is the other half of the instrument.

The XD3 measures and holds the data. XBase is the control surface: where a run gets armed and stopped, where a note gets attached to it, and where the record leaves the device for your PC.

The XBase Measure screen during a run: a dose-rate graph on a five-minute window, with the recording controls and the run memo directly below it.

Arm it, then leave it

Set a dose-rate threshold and arm the trigger. The run starts itself when the beam arrives, and the XD3 keeps capturing even if the link drops.

Every run comes back as a record

Each run carries the device timestamp and whatever note you typed while it ran. Pick a day or a month on the calendar, and it lands on your PC, filed by date.

  • Watch and operate in one place — the rolling dose-rate graph, right next to the controls that start, stop, and annotate the run.
  • Timestamps that line up — records are stamped by the device clock; XBase checks it against your PC and corrects it before you measure.
  • Keeps the device up to date — the XD3 takes new firmware over Wi-Fi, gaining features and fixes after it ships.

Quality

Every unit ships with its own test report.

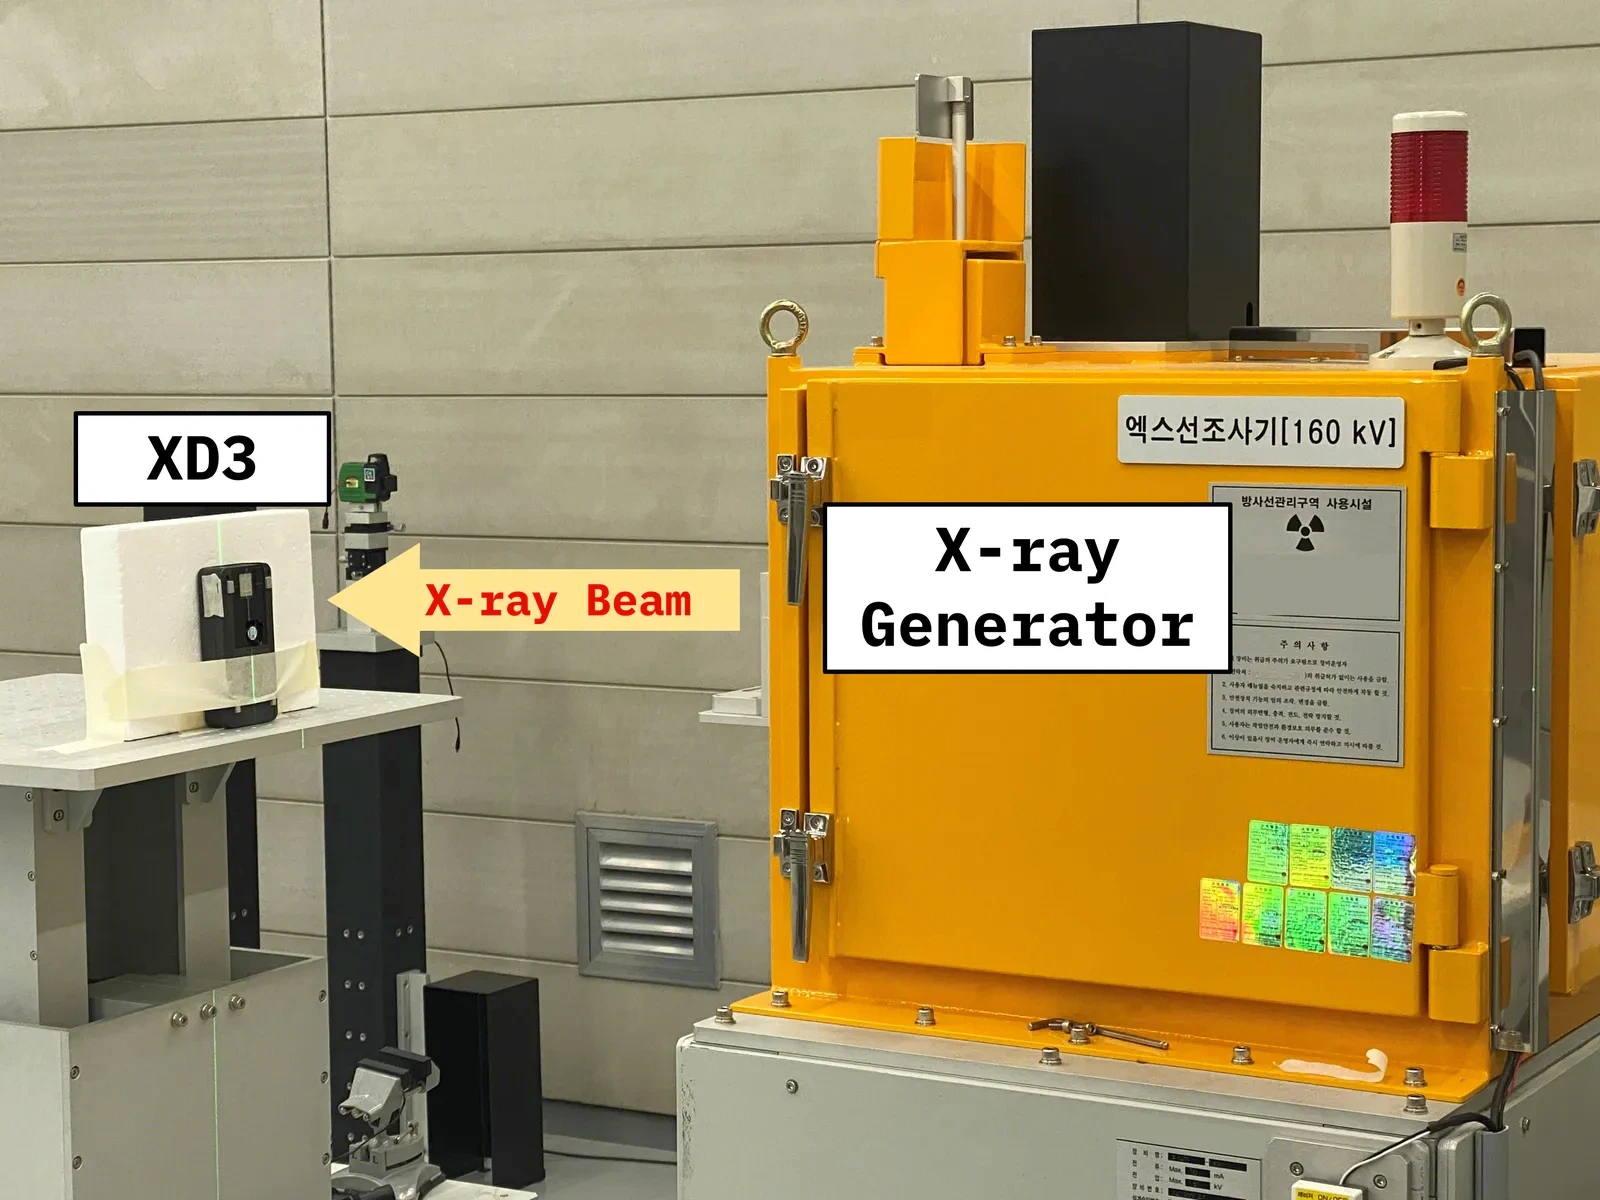
The shipment test in progress at the standard-beam facility: an XD3, labelled, is taped to a foam block on a positioning table with an alignment laser on it, facing the port of a large X-ray irradiator cabinet across the room. An arrow marks the beam running from the cabinet to the device.

Before it ships, every XD3 is measured against narrow-spectrum X-ray reference beams — fields whose values are fixed and known, so each unit's readings have something definite to be compared against.

  • Two beam qualities — ISO 4037 N60 and N120, generated at 60 kV and 120 kV, with mean energies of 48 and 100 keV. Line those tube voltages up against the settings your own machine runs.
  • Traceable reference values — the laboratory's calibration is accredited to ISO/IEC 17025, and the values it establishes for those beams are traceable to national measurement standards.
  • Energy response and linearity — we hold both to within ±5% of the reference value at each beam quality.

Contact us

Ask us anything about dose in your inspection process. We will give you a straight answer.

info@radiatesol.com

Who we are, and how we got here →